Quick Answer
Average Class 8 truck operating cost: $2.26 per mile ($1.27 per mile before driver wages and benefits) (2025)
Top 5 expense categories:
- Driver wages & benefits: $1.00/mile (44%)
- Fuel & DEF: $0.60-0.70/mile (27-31%)
- Truck & trailer payments: $0.33/mile (15%)
- Repairs & maintenance: $0.20/mile (9%)
- Insurance: $0.15/mile (7%)
Source: American Transportation Research Institute (ATRI) 2024 Operational Costs Study
TL;DR
Current industry average: In 2025, running a Class 8 truck costs $2.26/mile on average across for-hire carriers (down slightly from 2023's $2.27/mile).
Biggest line items: Driver wages/benefits ($1.00/mile), fuel ($0.60-0.70/mile), truck & trailer payments ($0.33/mile), maintenance ($0.20/mile), and insurance ($0.15/mile). In 2022 (for context), ATRI recorded similar proportions with wages at $0.724/mile and fuel at $0.641/mile.
Your number will vary by sector (TL, LTL, reefer, flatbed), region, utilization, equipment age, and financing strategy.
What "cost per mile" (CPM) actually includes
Your total CPM usually combines:
Variable costs: Fuel, DEF, tires, tolls, repairs & maintenance.
Fixed / time-based costs (allocated by miles): Truck & trailer lease or depreciation, insurance, permits & licenses, back-office/overhead, and driver pay/benefits.
Industry benchmarking from ATRI (American Transportation Research Institute) is the standard reference; their latest reporting shows the 2024 all-in average at ~$2.26/mile (slightly lower than 2023's $2.27/mile).
Why you still see 2022 numbers in articles: 2022 was a spike year where costs first topped $2.25/mile; those line-item breakouts are still helpful for context and modeling.
Typical per-mile breakdown (benchmark context)
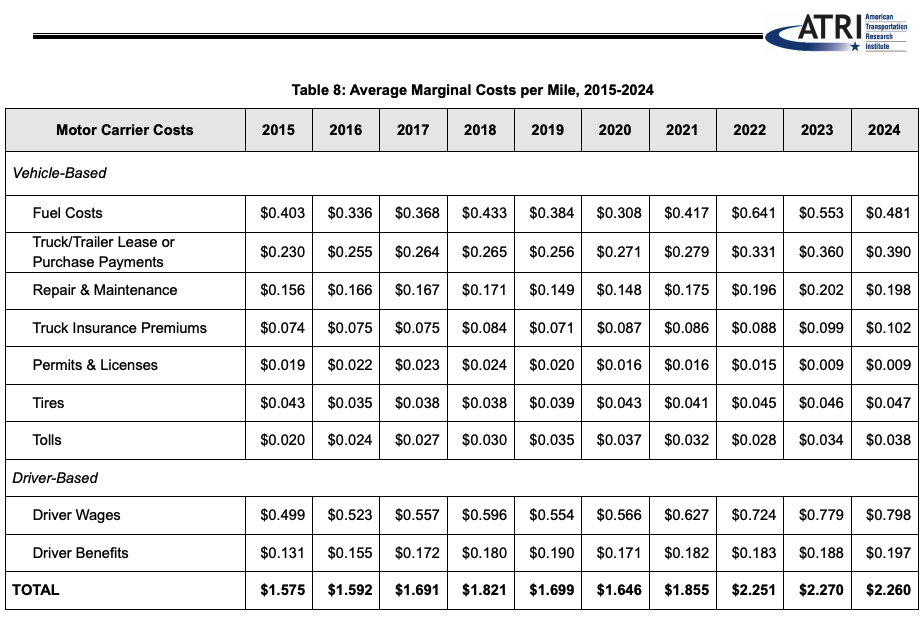
Recent benchmark highlights from ATRI's 2024 Operational Costs study:

- All-in average CPM: $2.27 (2023) → $2.26 (2024)
- CPM before driver pay & benefits: $1.30 (2023) → $1.27 (2024)
- Driver wages & benefits: $0.97 (2023) → $1.00 (2024)
- Non-fuel costs rose even as diesel eased in 2024; excluding fuel, 2024 marginal costs hit a record $1.779/mile
- Context from 2022 (per-mile): Fuel $0.641, Driver wages $0.724, Truck+trailer $0.331, R&M $0.196; permits/licenses & tolls were smaller shares
Class 8 CPM Historical Comparison (2022-2025)
2022 Baseline:
- Total CPM: $2.251
- Fuel: $0.641 | Driver Pay: $0.724 | Equipment: $0.331 | Maintenance: $0.196 | Insurance: $0.158
2023:
- Total CPM: $2.270
- Fuel: ~$0.60 | Driver Pay: $0.970 | Equipment: $0.330 | Maintenance: $0.195 | Insurance: $0.160
2024:
- Total CPM: $2.260
- Fuel: ~$0.60 | Driver Pay: $1.000 | Equipment: $0.330 | Maintenance: $0.200 | Insurance: $0.150
2025 (Projected):
- Total CPM: $2.260
- Fuel: ~$0.65 | Driver Pay: $1.020 | Equipment: $0.335 | Maintenance: $0.205 | Insurance: $0.155
Note: 2025 figures are projections based on current industry trends and economic indicators
Key Trend: Driver compensation has increased 40% since 2022, while fuel costs have stabilized. Equipment costs remain elevated due to higher interest rates and truck prices.
Takeaway: Driver compensation and equipment payments are now as pivotal as fuel when managing CPM.
How to calculate your Class 8 CPM (with an example)
Formula:
CPM = (All operating costs for the period) ÷ (Total dispatched miles in the period)
Step-by-step process:
1. Add fixed/time-based costs for the period
- Lease or loan payment, insurance, permits & licenses, ELD/tech, office, etc.
2. Add variable costs for the period
- Fuel + DEF, tires, tolls, parking, wash, repair/maintenance
3. Divide by dispatched miles
- Use paid or all miles consistently (deadhead matters)
Example calculation:
- Monthly fixed/time-based costs: $12,000
- Monthly variable costs: $18,000
- Total dispatched miles: 15,000
CPM = ($12,000 + $18,000) / 15,000 = $30,000 / 15,000 = $2.00/mile
Compare your result to the industry average of $1.27/mile ($2.26/mile after driver pay & driver benefits) (2024) to see where you're high/low.
What moves CPM up or down?
Key factors affecting your cost per mile:
Fuel price & MPG: Fuel is still a top driver; a ±$0.50/gal swing or 1 MPG change can move CPM meaningfully. (In 2023, industry CPM rose to $2.27 even as fuel eased - because non-fuel costs climbed.)
Driver wages & benefits: Competitive pay has structurally risen since the pandemic years; benefits growth continued into 2024.
Equipment costs & interest rates: Higher prices and financing costs keep truck & trailer payments elevated.
Maintenance & tires: Newer equipment may lower R&M; older equipment can cut payments but raise shop time and parts.
Utilization: More loaded miles and fewer empty miles spread fixed costs over more revenue miles, lowering CPM.
Freight mix & geography: Reefer/flatbed often carry higher R&M and insurance; heavy toll regions add CPM quickly.
Owner-operator vs. fleet CPM
Owner-operators can sometimes beat averages via tight cost control and high utilization, but face volatility (cash flow, repairs, insurance underwriting).
Fleets benefit from scale pricing (fuel, tires, insurance) but carry overhead.
Across the industry, 2024 CPM averaged ~$2.26, and operating margins were compressed, especially in TL.
10 proven ways to lower your cost per mile
- Improve MPG (speed discipline, cruise control, aero, idle reduction)
- Spec smart (low-rolling-resistance tires, optimized axle ratios)
- Fuel network discipline (buy on lane strategy, not just price on the sign)
- Preventive maintenance cadence to avoid roadside breakdowns
- Negotiate insurance (telematics, safety coaching, clean CSA)
- Finance strategically (total cost of ownership vs. lowest payment)
- Plan backhauls to trim deadhead miles
- Lane & customer mix (tolls, dwell, appointment reliability)
- Data hygiene (track CPM weekly; spot anomalies early)
- Driver retention (stable staffing reduces recruitment, training, and crash risk costs)
Frequently Asked Questions
What is the average cost per mile for a Class 8 truck in 2025?
The average cost per mile for a Class 8 truck in 2025 is $2.26, according to ATRI research. This all-in cost includes all operating expenses: driver wages and benefits ($1.00/mile), fuel and DEF ($0.60-0.70/mile), truck and trailer payments ($0.33/mile), repairs and maintenance ($0.20/mile), insurance ($0.15/mile), and other operating costs. This figure represents industry-wide data from for-hire carriers and provides a reliable benchmark for owner-operators and fleets.
How do I calculate cost per mile for my truck?
Calculate your cost per mile (CPM) by dividing your total operating costs by total miles driven in the same period. Formula: CPM = (Fixed costs + Variable costs) ÷ Total miles. For example: If you have $12,000 in monthly fixed costs (lease payment, insurance, permits) and $18,000 in variable costs (fuel, maintenance, tolls), and you drive 15,000 miles, your CPM would be ($12,000 + $18,000) ÷ 15,000 = $2.00/mile. Track this monthly to identify cost trends and optimize your operations.
What is the biggest expense for Class 8 trucks?
Driver wages and benefits are the single largest expense at approximately $1.00 per mile, representing 44% of total operating costs. This includes base pay, benefits, and payroll taxes. Fuel is the second-largest expense at $0.60-0.70 per mile (27-31%), followed by truck and trailer payments at $0.33/mile (15%). Driver compensation has increased significantly since 2022 (up 40%) due to competitive labor market conditions and rising benefit costs.
Is $2.26 per mile profitable for trucking?
Profitability depends entirely on your revenue per mile (RPM) and utilization rate. If your RPM consistently exceeds $2.26/mile with good loaded mile percentage (above 85%), you can be profitable. However, many truckload carriers faced margin pressure in 2024 with spot rates often below $2.00/mile. Contracted freight with rates above $2.50/mile typically provides sustainable margins. Calculate your break-even RPM and target rates at least 15-20% above your CPM for healthy profitability.
How can owner-operators reduce their cost per mile?
Top strategies to reduce CPM include: 1) Improve fuel efficiency through speed management and route optimization (can save $0.10-0.15/mile), 2) Perform preventive maintenance to avoid costly breakdowns (saves $0.05-0.10/mile annually), 3) Reduce deadhead miles through strategic backhaul planning (saves $0.20-0.30/mile), 4) Negotiate better insurance rates with telematics and safety programs (saves $0.02-0.05/mile), 5) Join fuel network programs for discounts (saves $0.05-0.10/mile), and 6) Maintain consistent drivers to reduce turnover costs.
Why do some articles cite different cost per mile figures ($2.25, $2.27, etc.)?
The year of the data matters significantly. According to ATRI's annual studies: 2022 averaged $2.251/mile (a record at the time due to fuel spikes), 2023 was $2.27/mile (highest ever), and 2024 came in at $2.26/mile (slight decrease as fuel stabilized). ATRI publishes updated figures annually based on comprehensive carrier surveys, so always check the study year when comparing CPM figures. Regional variations, fleet size, and operational type (TL vs LTL, reefer vs dry van) also cause CPM differences.
What's the single biggest lever to reduce costs?
While driver compensation ($1.00/mile) and fuel ($0.60-0.70/mile) are the largest absolute costs, fuel efficiency offers the most controllable lever. Improving from 6 MPG to 7 MPG at $3.50/gal diesel reduces fuel cost by $0.09/mile. Combined with reducing deadhead miles (targeting 90%+ loaded miles vs. 80%) and preventive maintenance practices, owner-operators can realistically reduce CPM by $0.15-0.25/mile compared to industry averages.
How often should I recalculate my cost per mile?
Calculate CPM monthly at minimum to track trends and identify cost anomalies early. Recalculate weekly during volatile fuel markets (when diesel swings more than $0.25/gal in a month) or when making operational changes like switching lanes, adding/changing equipment, or adjusting driver pay structures. Use consistent methodologies (always include/exclude the same cost categories) to ensure accurate period-over-period comparisons. Set up automated tracking in your accounting software or use TACH's CPM dashboard for real-time monitoring.
The bottom line
For planning and pricing in 2025, a practical benchmark for a Class 8 all-in CPM is ~$2.26/mile, with your actuals depending on fuel, wages/benefits, equipment financing, maintenance strategy, and utilization. Track it ruthlessly - and optimize what you can control.
How TACH helps reduce your cost per mile
At TACH, we understand that managing cash flow and reducing operating costs are critical for owner-operators and small fleets. Our financial platform helps truckers:
- See your CPM in the TACH Dashboard to understand your costs and identify opportunities to reduce them
- Track expenses automatically to identify cost-saving opportunities
- Get quick cash advances to handle maintenance before it becomes emergency repairs
- Manage maintenance costs with our network of preferred service providers
Ready to start reducing your operating costs? Get started with TACH today and join truckers nationwide who are taking control of their finances.